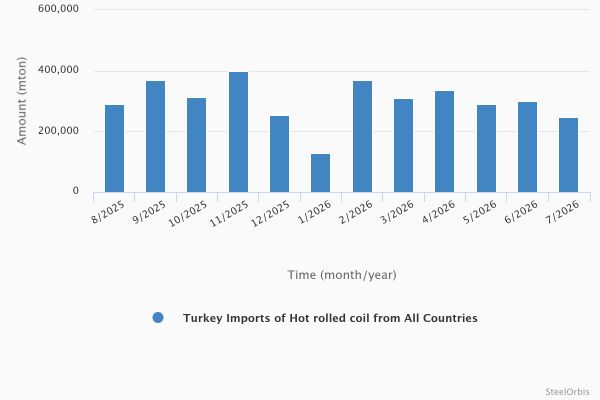
In July this year, Turkey's hot rolled coil (HRC) imports amounted to 246,875 metric tons, down by 17.8 percent compared to June and down by 39.9 percent year on year, according to the preliminary data provided by the Turkish Statistical Institute (TUIK). Meanwhile, the value of these imports totaled $144.92 million, decreasing by 15.1 percent compared to the previous month and decreasing by 34.4 percent year on year.
In the January-July period, Turkey's HRC imports amounted to 1.98 million mt, down 12.7 percent, while the value of these imports decreased by 12.7 percent to $1.09 billion, both year on year.
Turkey's hot rolled coil imports - last 12 months
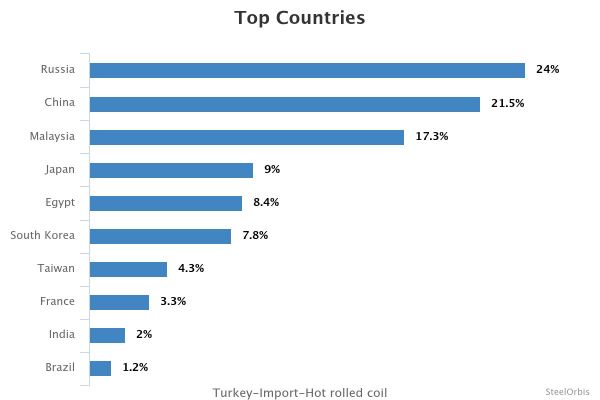
In the given period, Turkey's largest HRC import source was Russia, which supplied 474,661 mt, down 7.9 percent year on year. Russia was followed by China with 425,676 mt, down 53.5 percent, and Malaysia with 343,052 mt, compared to the same period last year.
The decline in Turkey's HRC imports appears to have become more pronounced in July. In the January-June period, imports stood at 1.73 million mt, down 6.7 percent year on year, while in the January-July period the decline deepened to 12.7 percent, with total volume reaching 1.98 million mt. This was mainly due to the 39.9 percent year-on-year decrease in July imports to 246,875 mt.
The main trend in the supplier structure remained unchanged. Russia continued to be Turkey's largest HRC supplier in the January-July period, as it was in January-June. The weakness in Chinese-origin imports became even more visible with the July data; imports from China had declined by 51.8 percent year on year in January-June, while the decrease reached 53.5 percent in January-July. Lower purchases from Egypt and South Korea were also among the factors weighing on total imports.
By contrast, Malaysia continued to increase its share. Imports from Malaysia rose from 277,395 mt in January-June to 343,052 mt in January-July. Purchases from Japan and Taiwan also partially limited the overall decline. Overall, the July data indicate that the limited decline seen in the first half of the year accelerated at the start of the third quarter, while China's weight in Turkey's HRC imports decreased and Russia and Malaysia became more visible.
Turkey's top 10 HRC import sources in the January-July period:
| Country | Amount (mt) | |||||
| January-July 2026 | January-July 2025 | Y-o-y change (%) | July 2026 | July 2025 | Y-o-y change (%) | |
| Russia | 474,661 | 515,120 | -7.9 | 64,815 | 100,254 | -35.3 |
| China | 425,676 | 914,800 | -53.5 | 83,907 | 205,314 | -59.1 |
| Malaysia | 343,052 | 504 | >1000.0 | 65,656 | - | - |
| Japan | 179,162 | 140,827 | 27.2 | - | - | - |
| Egypt | 166,820 | 277,842 | -40.0 | 18,811 | 34,275 | -45.1 |
| S. Korea | 153,446 | 219,031 | -29.9 | 105 | 49,133 | -99.8 |
| Taiwan | 84,399 | 39,687 | 112.7 | - | - | - |
| France | 65,818 | 78,848 | -16.5 | 7,709 | 8,302 | -7.1 |
| India | 38,737 | 5 | >1000.0 | - | - | - |
| Brazil | 23,102 | - | - | - | - | - |
Shares in Turkey's hot rolled coil imports - January-July 2026