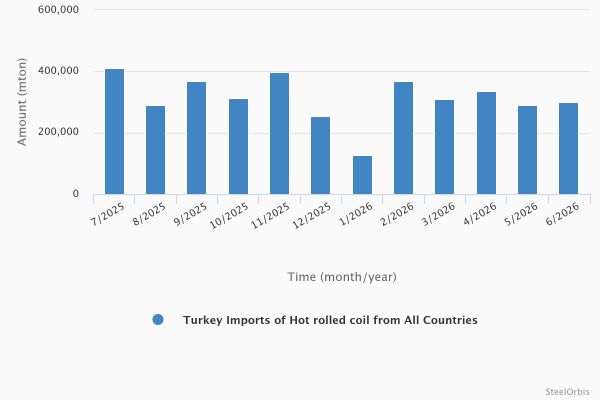
In June this year, Turkey's hot rolled coil (HRC) imports amounted to 300,255 metric tons, up by 3.1 percent compared to May and up by 4.1 percent year on year, according to the preliminary data provided by the Turkish Statistical Institute (TUIK). Meanwhile, the value of these imports totaled $170.77 million, increasing by 7.8 percent compared to the previous month and by 8.7 percent year on year.
In the January-June period, Turkey's HRC imports amounted to 1.73 million mt, down 6.7 percent, while the value of these imports decreased by 8.1 percent to $949.67 million, both year on year. The decline was mainly driven by lower imports from China and Egypt. Imports from China fell by 51.8 percent year on year to 341,769 mt, while imports from Egypt decreased by 39.2 percent to 148,009 mt.
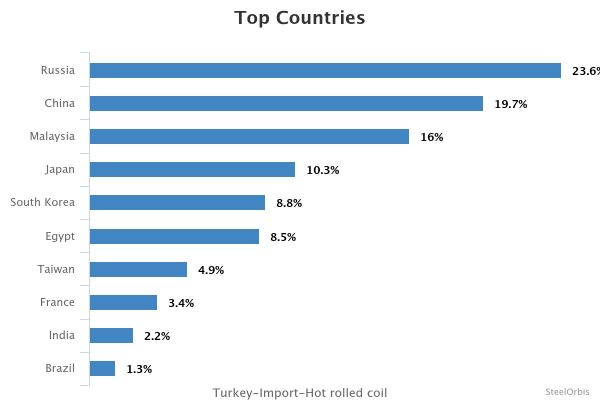
By contrast, Russia became Turkey's largest HRC supplier with 409,846 mt, despite a limited year-on-year decrease of 1.2 percent. The increase in imports from Malaysia to 277,395 mt from a very low level last year was one of the most notable changes in the supply structure. Imports from Japan also rose by 27.2 percent to 179,162 mt, partially limiting the overall decline.
In June, however, the picture was stronger. Turkey's monthly HRC imports increased by 4.1 percent year on year to 300,255 mt, while the value of these imports rose by 8.7 percent to $170.77 million. In June, imports from Russia increased by six percent to 111,257 mt, imports from Japan rose by 53.4 percent to 41,272 mt, and imports from Egypt were up 8.1 percent to 37,102 mt. By contrast, imports from China fell by 15 percent to 58,700 mt in June, indicating that the weakness in Chinese-origin material continued.
Turkey's hot rolled coil imports - last 12 months
In the given period, Turkey's largest HRC import source was Russia, which supplied 409,846 mt, down 1.2 percent year on year. Russia was followed by China with 341,769 mt, down 51.8 percent and Malaysia with 277,395 mt, up sharply year on year.
Turkey's top 10 HRC import sources in the January-June period:
| Country | Amount (mt) | |||||
| January-June 2026 | January-June 2025 | Y-o-y change (%) | June 2026 | June 2025 | Y-o-y change (%) | |
| Russia | 409,846 | 414,866 | -1.2 | 111,257 | 104,968 | 6.0 |
| China | 341,769 | 709,486 | -51.8 | 58,700 | 69,082 | -15.0 |
| Malaysia | 277,395 | 504 | >1000.0 | 11,862 | - | - |
| Japan | 179,162 | 140,827 | 27.2 | 41,272 | 26,914 | 53.4 |
| S. Korea | 153,336 | 169,899 | -9.7 | 27,923 | 36,714 | -23.9 |
| Egypt | 148,009 | 243,568 | -39.2 | 37,102 | 34,328 | 8.1 |
| Taiwan | 84,399 | 39,687 | 112.7 | - | - | - |
| France | 58,109 | 70,546 | -17.6 | 10,434 | 13,189 | -20.9 |
| India | 38,737 | 5 | >1000.0 | - | - | - |
| Brazil | 23,102 | - | - | - | - | - |
Shares in Turkey's hot rolled coil imports - January-June 2026