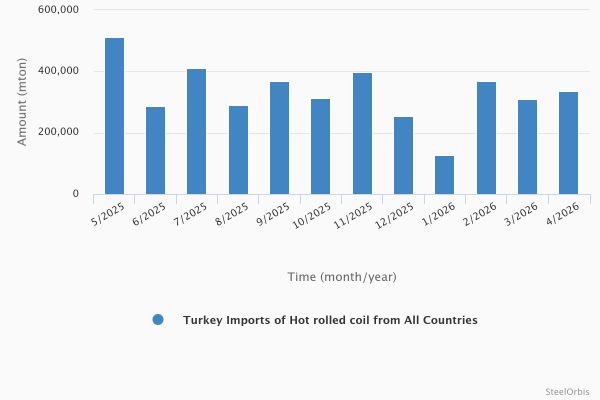
In April this year, Turkey’s hot rolled coil (HRC) imports amounted to 334,852 metric tons, up by 8.2 percent compared to March and by 46.7 percent year on year, according to the preliminary data provided by the Turkish Statistical Institute (TUIK). Meanwhile, the value of these imports totaled $181.10 million, increasing by 9.2 percent compared to the previous month and by 38.8 percent year on year.
In the January-April period of this year, Turkey's HRC imports amounted to 1,141,364 mt, up 8.1 percent, while the value of these imports increased by 3.3 percent to $620.42 million, both year on year.
Turkey’s hot rolled coil imports - last 12 months
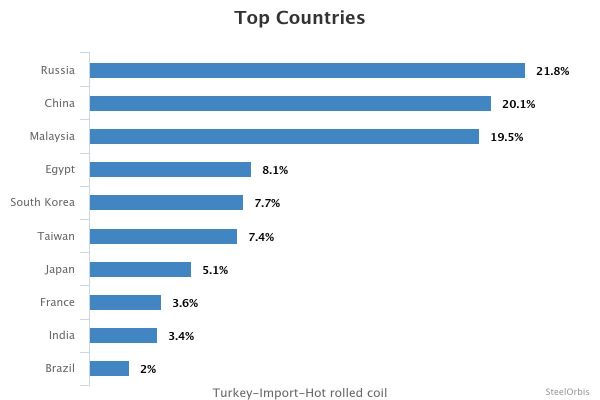
In the given period, Turkey’s largest HRC import source was Russia, which supplied 248,889 mt, up 9.2 percent year on year. Russia was followed by China with 229,800 mt, down 39.6 percent, and Malaysia with 223,029 mt.
The latest Excel data indicate that Turkey’s hot rolled coil imports increased not only in terms of volume, but also underwent a clear rebalancing in supplier structure. The 8.1 percent year-on-year rise in total imports in the January-April period suggests that demand for imported HRC in the domestic market remained in place, while the 39.6 percent decline in volumes from China is particularly noteworthy. This decrease appears to have been influenced by trade measures targeting Chinese-origin products and importers’ shift toward alternative supply sources. Indeed, Russia’s rise to the top spot, Malaysia’s strong increase and the entry of India and Brazil into the list suggest that buyers are trying to diversify supply risks. The fact that imports increased both month on month and year on year in April also shows that market demand has not fully weakened, but purchasing activity has become more selective depending on price, delivery time and origin advantages. As China’s weight in Turkey’s HRC imports declines and Russia, Malaysia and other alternative sources gain share, price competition and trade measures are likely to remain key factors shaping the market direction in the coming period.
Turkey’s top 10 HRC import sources in the January-April period:
| Country | Amount (mt) | |||||
| January-April 2026 | January-April 2025 | Y-o-y change (%) | April 2026 | April 2025 | Y-o-y change (%) | |
| Russia | 248,889 | 227,836 | 9.2 | 68,493 | 48,474 | 41.3 |
| China | 229,800 | 380,508 | -39.6 | 108,144 | 76,486 | 41.4 |
| Malaysia | 223,029 | 504 | >1000.0 | 55,741 | 504 | >1000.0 |
| Egypt | 92,552 | 109,830 | -15.7 | 20,720 | 52,321 | -60.4 |
| S. Korea | 87,424 | 106,997 | -18.3 | 22,385 | 6,859 | 226.3 |
| Taiwan | 84,399 | 39,687 | 112.7 | 43,695 | - | - |
| Japan | 57,891 | 84,844 | -31.8 | 0 | 24,641 | -100.0 |
| France | 41,046 | 45,101 | -9.0 | 12,786 | 13,656 | -6.4 |
| India | 38,737 | 5 | >1000.0 | 0 | - | - |
| Brazil | 23,102 | - | - | 0 | - | - |
Shares in Turkey’s hot rolled coil imports - January-April 2026