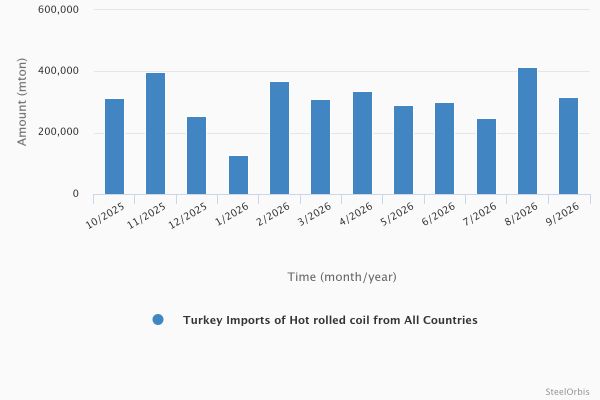
In September this year, Turkey's hot rolled coil (HRC) imports amounted to 317,024 metric tons, down by 23.3 percent compared to August and down by 14.0 percent year on year, according to the preliminary data provided by the Turkish Statistical Institute (TUIK). Meanwhile, the value of these imports totaled $191.88 million, decreasing by 20.9 percent compared to the previous month and by 2.7 percent year on year.
In the January-September period, Turkey's HRC imports amounted to 2.71 million mt, down 7.4 percent, while the value of these imports decreased by 4.7 percent to $1.53 billion, both year on year.
Turkey's hot rolled coil imports - last 12 months
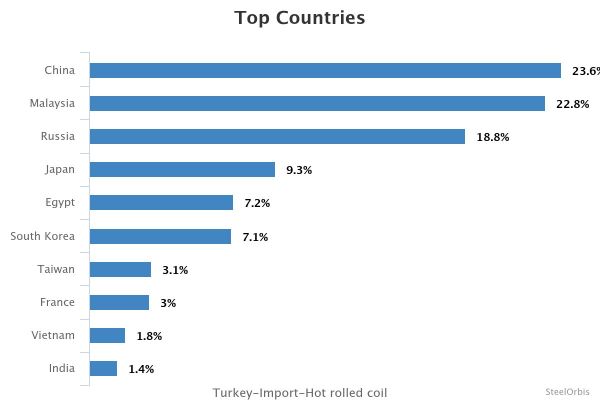
In the given period, Turkey's largest HRC import source was China, which supplied 639,991 mt, down 43.5 percent year on year. China was followed by Malaysia with 617,454 mt, up 500.3 percent, and Russia with 510,260 mt, down 28.3 percent year on year.
The August rebound was not sustained in September. HRC imports fell by 23.3 percent month on month and 14.0 percent year on year to 317,024 mt, causing the cumulative decline to widen from 6.5 percent in January-August to 7.4 percent in January-September.
The supplier ranking shifted again with the September data. China remained Turkey's largest HRC supplier with 639,991 mt despite a 43.5 percent annual decline, while Malaysia moved ahead of Russia into second place as its cumulative shipments surged by 500.3 percent to 617,454 mt. In September alone, imports from Malaysia doubled year on year to 148,570 mt, while Russian-origin imports plunged by 99.1 percent to just 1,013 mt.
Japan also strengthened its position, with January-September imports rising by 78.7 percent to 251,701 mt. South Korean shipments remained down 20.0 percent cumulatively, although September imports more than doubled year on year. Vietnam entered the top 10 with 49,040 mt, all recorded in September, while imports from Egypt fell by 98.2 percent year on year during the month. Overall, September points to a sharp monthly shift toward Malaysia, Vietnam, Japan and South Korea, while arrivals from Russia and Egypt nearly disappeared.
Turkey's top 10 HRC import sources in the January-September period:
| Country | Amount (mt) | |||||
| January-September 2026 | January-September 2025 | Y-o-y change (%) | September 2026 | September 2025 | Y-o-y change (%) | |
| China | 639,991 | 1,132,838 | -43.5 | 65,573 | 85,172 | -23.0 |
| Malaysia | 617,454 | 102,863 | 500.3 | 148,570 | 74,283 | 100.0 |
| Russia | 510,260 | 711,428 | -28.3 | 1,013 | 112,763 | -99.1 |
| Japan | 251,701 | 140,827 | 78.7 | 20,624 | - | - |
| Egypt | 194,269 | 344,964 | -43.7 | 900 | 51,112 | -98.2 |
| S. Korea | 191,266 | 239,155 | -20.0 | 21,683 | 9,320 | 132.6 |
| Taiwan | 84,399 | 39,687 | 112.7 | - | - | - |
| France | 81,139 | 94,353 | -14.0 | 7,986 | 9,716 | -17.8 |
| Vietnam | 49,040 | - | - | 49,040 | - | - |
| India | 38,737 | 5 | >1000.0 | - | - | - |
Shares in Turkey's hot rolled coil imports - January-September 2026