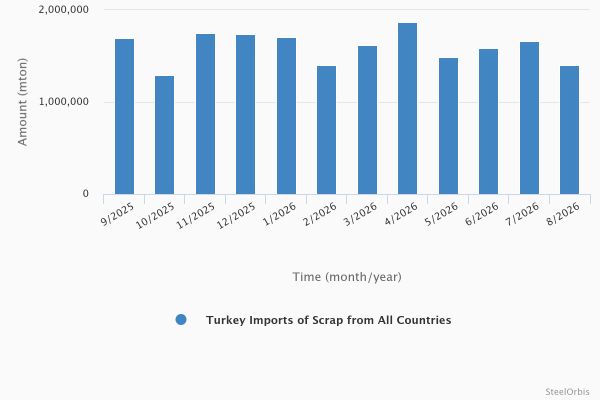
In August this year, Turkey's scrap import volume increased by 0.5 percent year on year but decreased by 15.7 percent month on month to 1.40 million mt, according to the data provided by the Turkish Statistical Institute (TUIK). The value of these imports totaled $561.89 million, up 11.5 percent year on year and down 18.6 percent month on month.
In the first eight months of the year, Turkey's scrap imports amounted to 12.73 million mt, up 4.0 percent, while the value of these imports increased by 9.0 percent to $5.02 billion, both year on year.
Turkey's scrap imports - last 12 months
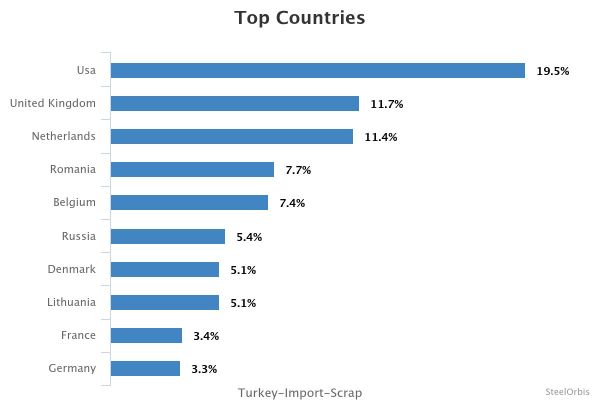
The US remained Turkey's largest scrap supplier in January-August, with shipments increasing by 7.2 percent year on year to 2.48 million mt. However, US-origin imports fell by 14.0 percent year on year to 269,070 mt in August, showing that the cumulative increase was not sustained in the latest month.
The UK moved ahead of the Netherlands into second place, with January-August shipments rising by 4.3 percent to 1.50 million mt and August shipments increasing by 27.0 percent year on year. Imports from the Netherlands fell by 25.8 percent to 1.46 million mt, a decrease of 507,293 mt, the largest absolute decline among suppliers. Dutch shipments also fell by 59.8 percent in August.
Romania recorded the largest absolute increase, adding 365,104 mt as shipments rose by 59.1 percent to 982,846 mt. Imports from Russia increased by 31.8 percent to 691,175 mt, placing it sixth, while France ranked ninth with 428,809 mt, up 43.8 percent. Imports from Lithuania grew by 15.7 percent to 646,635 mt and those from Bulgaria rose by 110.6 percent to 250,814 mt. In August, Russian and French shipments increased by 87.7 percent and 359.1 percent year on year, respectively, while Lithuanian shipments declined by 17.0 percent.
Turkey's top 10 scrap import sources in the January-August period are as follows:
| Country | Amount (mt) | |||||
|---|---|---|---|---|---|---|
| January-August 2026 | January-August 2025 | Y-o-y change (%) | August 2026 | August 2025 | Y-o-y change (%) | |
| US | 2,483,117 | 2,315,467 | 7.2 | 269,070 | 313,050 | -14.0 |
| UK | 1,496,620 | 1,434,359 | 4.3 | 224,022 | 176,421 | 27.0 |
| Netherlands | 1,455,643 | 1,962,936 | -25.8 | 87,300 | 217,186 | -59.8 |
| Romania | 982,846 | 617,742 | 59.1 | 79,603 | 73,697 | 8.0 |
| Belgium | 940,922 | 967,175 | -2.7 | 121,623 | 151,784 | -19.9 |
| Russia | 691,175 | 524,487 | 31.8 | 127,000 | 67,645 | 87.7 |
| Denmark | 651,393 | 639,618 | 1.8 | 5,909 | 68,319 | -91.4 |
| Lithuania | 646,635 | 558,828 | 15.7 | 30,498 | 36,746 | -17.0 |
| France | 428,809 | 298,231 | 43.8 | 68,750 | 14,976 | 359.1 |
| Germany | 423,775 | 398,357 | 6.4 | 52,332 | - | - |
Shares in Turkey's scrap imports - January-August 2026