In June this year, Turkey's slab imports amounted to 84,068 mt, up 49.48 percent month on month but decreasing by 52.57 percent year on year, according to the data provided by the Turkish Statistical Institute (TUIK). The total value of Turkey's slab imports in the given month was $44.41 million, up 51.83 percent month on month but decreasing by 52.92 percent compared to June 2013. According to the data for June this year, the average price for Turkish slab imports in the given month was $528.26/mt, increasing $8.17/mt from the average of $520.09/mt recorded in the previous month.
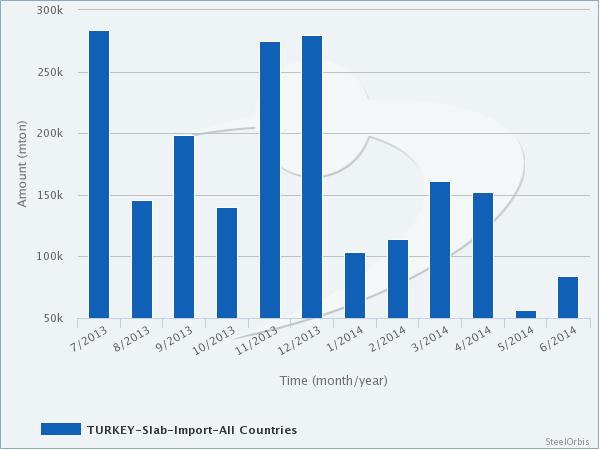
In the first half of the current year, Turkey's slab imports decreased by 30.84 percent year on year to 671,805 mt. Meanwhile, the value of Turkey's slab imports in this period was $353.72 million, down 28.38 percent year on year.
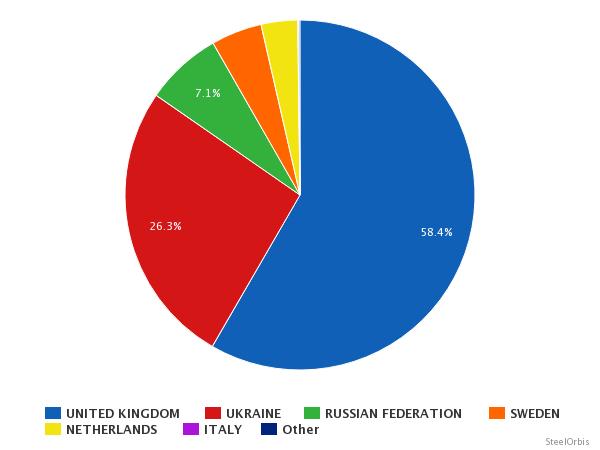
In the first half of this year, Turkey imported 392,587 metric tons of slab from the UK, up 22.2 percent year on year. The UK was Turkey's largest slab import source in the period in question, followed by Ukraine, which supplied 176,829 mt, up 66.43 percent year on year. Meanwhile, in the given period, Turkey's slab imports from Russia, which was the top slab import source for Turkey last year, decreased by 88.11 percent year on year to 47,628 mt, due to Russia preferring to sell its high-priced slab to the US rather than to Turkey.
Turkey's slab import sources in the first half of this year are as follows:
| Country | Amount (mt) | |||||
| H1 2014 | H1 2013 | Y-o-y change (%) | June 2014 | June 2013 | Y-o-y change (%) | |
| UK | 392,587 | 321,253 | 22.20 | 46,369 | 91,625 | -14.09 |
| Ukraine | 176,829 | 106,247 | 66.43 | 20,456 | 20,046 | 0.39 |
| Russia | 47,628 | 400,444 | -88.11 | 17,025 | 65,568 | -12.12 |
| Sweden | 31,599 | 67,922 | -53.48 | - | - | |
| Netherlands | 22,709 | - | - | - | - | - |
| Italy | 409 | 113 | 261.95 | 218 | - | - |
| Germany | 22 | 84 | -73.81 | - | - | - |
| Czech Rep. | 21 | - | - | - | - | - |
| Australia | 1 | 1 | - | - | - | - |
Turkey's sources of imported slab in the January-June period of the current year can be seen in the graph below: