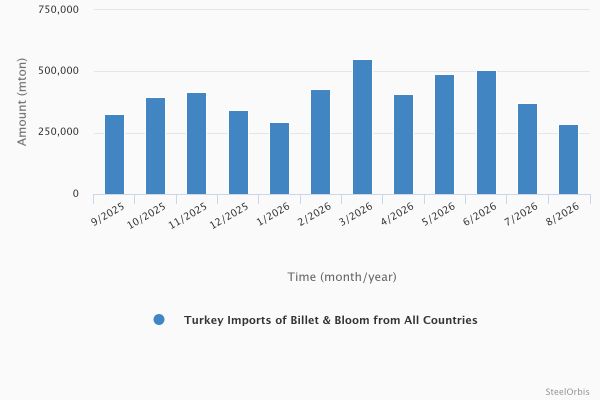
In August this year, Turkey's billet and bloom imports amounted to 284,733 metric tons, down by 23.5 percent compared to July and down by 24.7 percent year on year, according to the preliminary data provided by the Turkish Statistical Institute (TUIK). Meanwhile, the value of these imports totaled $150.20 million, down by 23.8 percent compared to the previous month and down by 20.0 percent year on year.
In the January-August period of 2026, Turkey's billet and bloom imports amounted to 3.34 million mt, up 15.2 percent, while the value of these imports increased by 15.9 percent to $1.68 billion, both year on year.
Turkey's billet and bloom imports - last 12 months
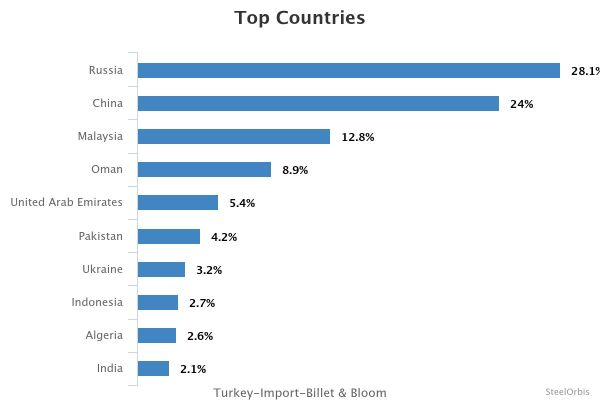
In the given period, Turkey's largest billet and bloom import source was Russia, which supplied 935,338 mt, up 45.2 percent year on year. Russia was followed by China with 800,355 mt, up 53.5 percent, and Malaysia with 426,416 mt, down 39.0 percent year on year.
The increase over the period was mainly driven by stronger imports from Russia and China. Imports from Russia rose by 45.2 percent year on year to 935,338 mt, while imports from China increased by 53.5 percent to 800,355 mt. Higher purchases from Oman, up 135.2 percent to 297,409 mt, the UAE, up 209.8 percent to 179,288 mt, and Pakistan, up 133 percent to 140,260 mt, also supported the overall growth. By contrast, imports from Malaysia decreased by 39 percent to 426,416 mt, while imports from Ukraine fell by 25 percent to 107,393 mt.
In August, however, sharp changes were seen in the supplier distribution. Imports from Russia fell by 76.3 percent year on year to 18,785 mt, while imports from China decreased by 24 percent to 107,954 mt, and no shipments were recorded from Malaysia, the UAE, Ukraine or Algeria. By contrast, imports from Oman amounted to 85,559 mt, while purchases from Pakistan surged by 293.1 percent to 27,090 mt. Overall, the data indicate that the strong year-on-year increase in January-August was largely driven by high-volume purchases in the earlier months of the year, while import momentum weakened significantly in August and the supplier mix temporarily shifted away from Russia toward alternative sources such as Oman, Pakistan and India.
Turkey's top 10 billet and bloom import sources in the January-August period:
| Country | Amount (mt) | |||||
| January-August 2026 | January-August 2025 | Y-o-y change (%) | August 2026 | August 2025 | Y-o-y change (%) | |
| Russia | 935,338 | 644,299 | 45.2 | 18,785 | 79,152 | -76.3 |
| China | 800,355 | 521,338 | 53.5 | 107,954 | 141,989 | -24.0 |
| Malaysia | 426,416 | 699,483 | -39.0 | - | 12,221 | -100.0 |
| Oman | 297,409 | 126,452 | 135.2 | 85,559 | - | - |
| UAE | 179,288 | 57,870 | 209.8 | - | - | -100.0 |
| Pakistan | 140,260 | 60,202 | 133.0 | 27,090 | 6,892 | 293.1 |
| Ukraine | 107,393 | 143,226 | -25.0 | - | 25,558 | -100.0 |
| Indonesia | 89,632 | 84,898 | 5.6 | - | - | - |
| Algeria | 87,531 | 70,748 | 23.7 | - | 20,368 | -100.0 |
| India | 70,735 | 57,986 | 22.0 | 20,038 | - | >1000.0 |
Shares in Turkey's billet and bloom imports - January-August 2026