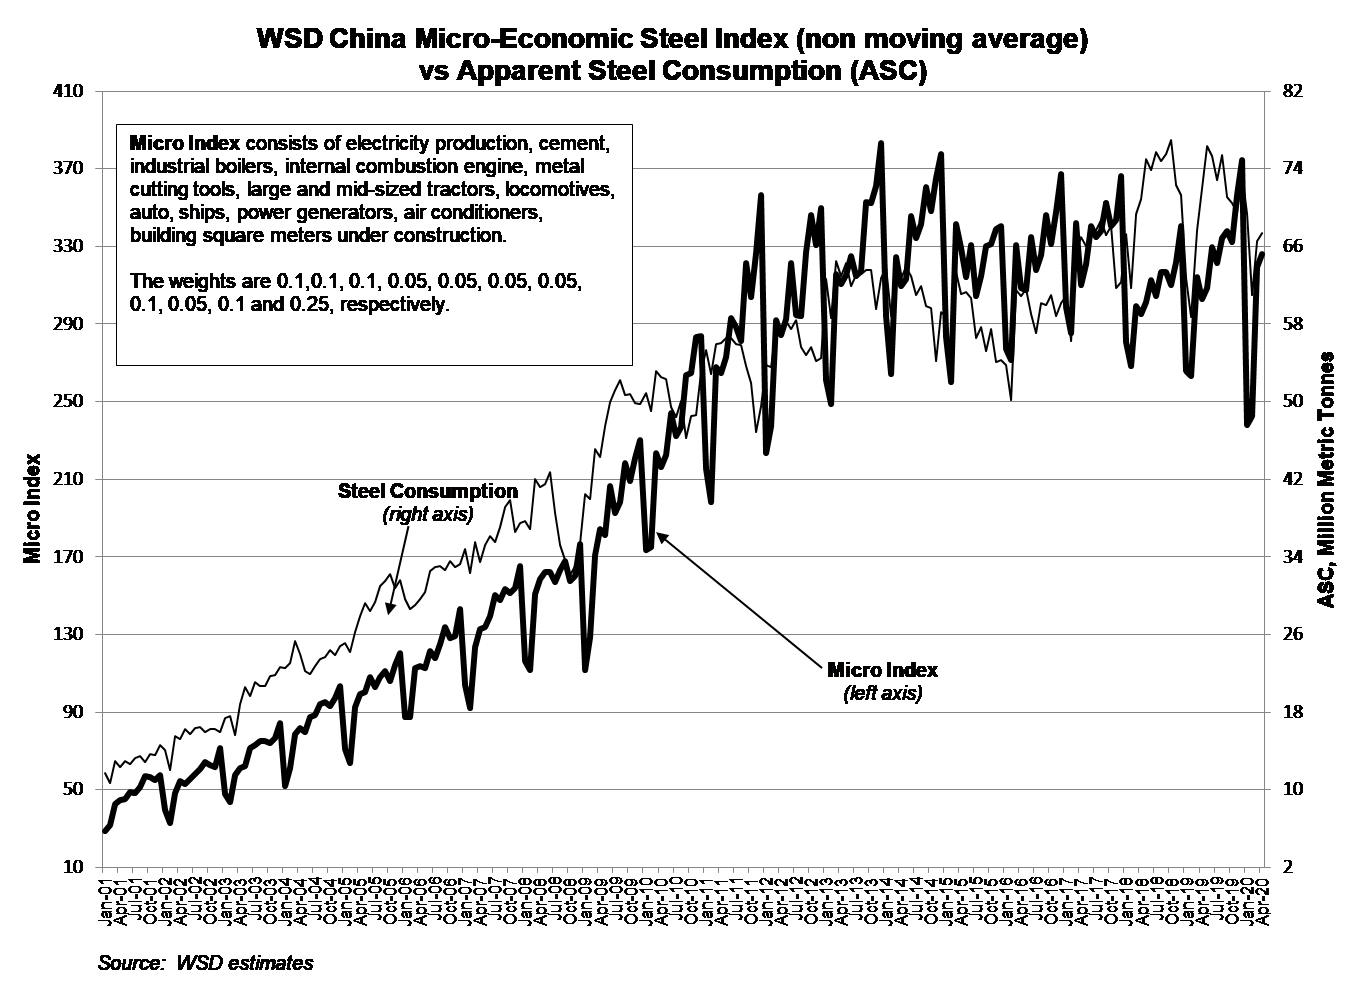
WSD employs two monthly indices that seek to track activity levels in China’s steel-consuming sectors. The Macro Index consists of four weighted macroeconomic data series. The Micro Index consists of 12 weighted activity figures for industries or sectors of the economy. The Macro Index consists of items that are reported on a revenue basis. The Micro Index consists of items that are reported on a unit basis, including a 25% weighting for building square meters under construction.
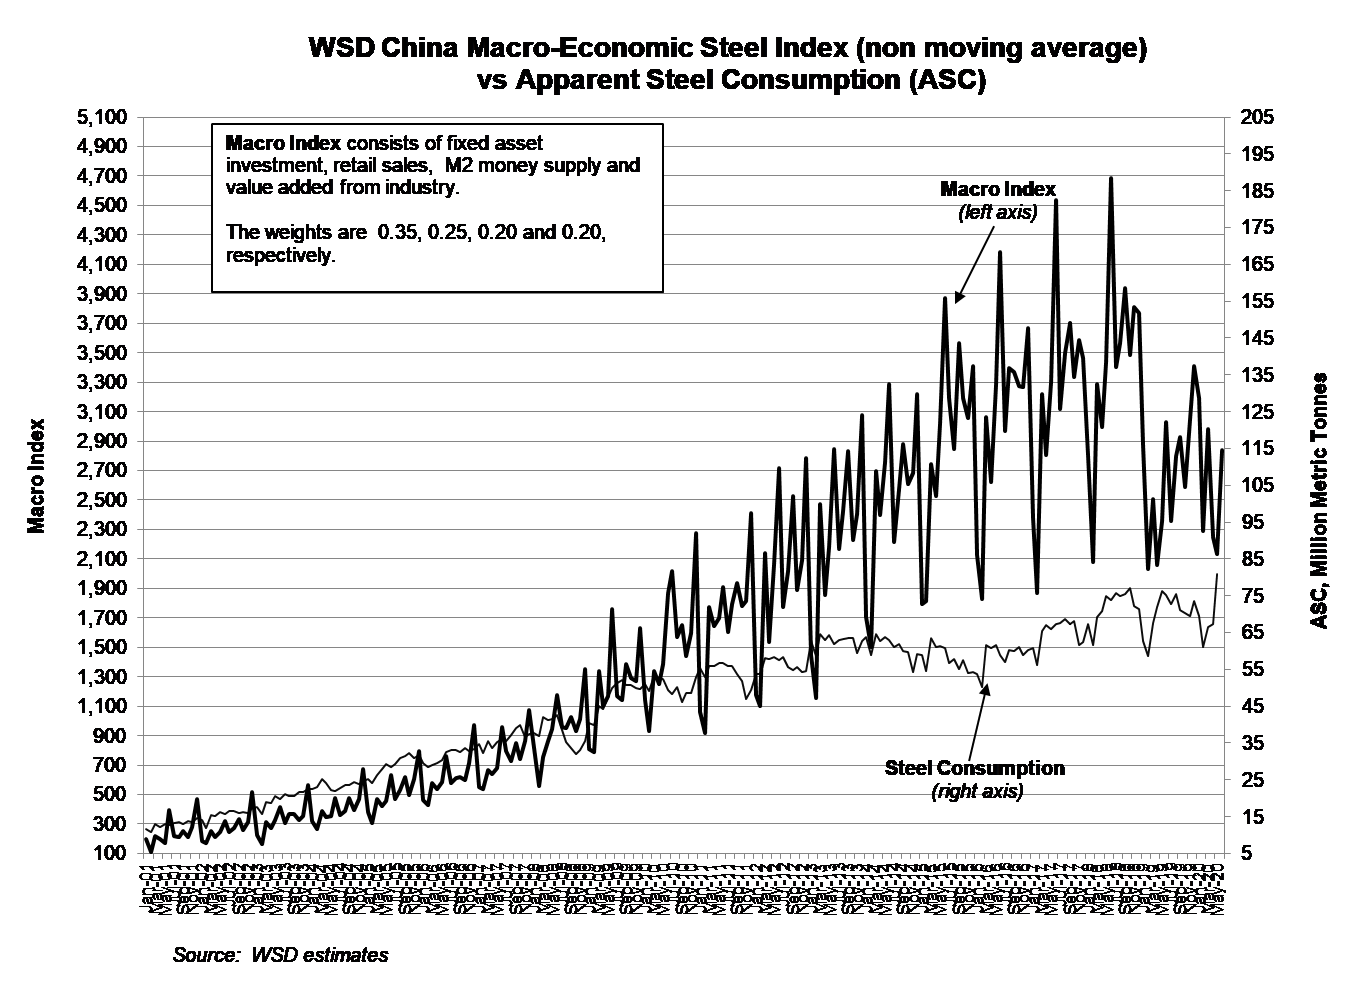
The Macro Index is particularly unreliable – as we’ve noted in prior reports. The index consists of our 6- or 12-month moving average figures for: 1) fixed asset investment (that, in turn, includes the figures for the value of land sales and M&A transactions); 2) retail sales; 3) the M2 money supply; and 4) value added by industry. The weighting of these items, respectively, is 35%, 25%, 20% and 20%. The data is submitted to the Central Government by local officials that, we observe, have an incentive to report favorable results (in order to keep their jobs).
The Macro and Micro Indices, at times, have a “life of their own.” And, at times they don’t move in sync with one another – or, at times, with the monthly figures for apparent steel demand:
- From 2001 to mid-2019, the Macro Index rose from 5 times to 12.5 times the Micro Index. Since then, it’s fallen to about 8 times the Micro Index.
- The Macro Index since mid-2019 to present has fallen more than 50%.
- Apparent steel consumption (ASC) tracked fairly closely with the Micro Index from 2001 to 2009; but, in the next 8 years, it fell about 40% relative to the Micro Index. Yet, since 2017, ASC is up about 26%; and the Micro Index is up 6%.
How does one explain, since 2017, the far greater rise in apparent steel consumption than our Micro and Macro Indices? Much of the reason is the strength in both residential construction activity and infrastructure spending – each of which account for about 12% of GDP. These activities are included in China’s fixed asset investment (FAI) figure that accounts for about 45% of the country’s GDP (when excluding the imbedded, and unknown, figures for land sales and M&A activity). FAI accounts for about 92% of steel consumption.
Chinese apparent steel demand in 2020 may rise about 5% after an 8% increase in 2019. Looking ahead to 2021, assuming significant carryover of the governments’ economic stimulation programs, Chinese apparent steel demand may increase a further 2%.
For June 2020, here are these figures on a year-to-year change basis – that, as noted, indicate the discrepancy between Micro and Macro Indices’ figures and apparent steel consumption:
| Item for June 2020 | Year-to-Year Change | |
| Macro Index | -6.3% | |
| Fixed asset investment | -29.3% | |
| Retail sales | -1.0% | |
| M2 money supply | 15.1% | |
| Value added by industry | 5.0% | |
| Micro Index | 7.1% | |
| Electricity production | 8.1% | |
| Cement | -4.2% | |
| Industrial boilers | -2.3% | |
| Internal combustion engines | -2.9% | |
| Metal cutting tools | -20.9% | |
| Large and mid-sized tractors | 72.3% | |
| Locomotives | -33.6% | |
| Automotive output | 22.4% | |
| Ships | -2.5% | |
| Power generators | 40.0% | |
| Air conditioners | 0.8% | |
| Building square meters | 8.8% | |
| Apparent steel consumption | 8.3% | |
This report includes forward-looking statements that are based on current expectations about future events and are subject to uncertainties and factors relating to operations and the business environment, all of which are difficult to predict. Although we believe that the expectations reflected in our forward-looking statements are reasonable, they can be affected by inaccurate assumptions we might make or by known or unknown risks and uncertainties, including among other things, changes in prices, shifts in demand, variations in supply, movements in international currency, developments in technology, actions by governments and/or other factors.
The information contained in this report is based upon or derived from sources that are believed to be reliable; however, no representation is made that such information is accurate or complete in all material respects, and reliance upon such information as the basis for taking any action is neither authorized nor warranted. WSD does not solicit, and avoids receiving, non-public material information from its clients and contacts in the course of its business. The information that we publish in our reports and communicate to our clients is not based on material non-public information.
The officers, directors, employees or stockholders of World Steel Dynamics Inc. do not directly or indirectly hold securities of, or that are related to, one or more of the companies that are referred to herein. World Steel Dynamics Inc. may act as a consultant to, and/or sell its subscription services to, one or more of the companies mentioned in this report.
Copyright 2020 by World Steel Dynamics Inc. all rights reserved