According to the data provided by the Turkish Statistical Institute (TUIK), in November 2014 Turkey's wire rod exports decreased by 29.3 percent year on year to 41,333 metric tons, down 17.2 percent month on month. The revenue from these exports amounted to $23.2 million, decreasing by 33 percent year on year and falling 22.5 percent month on month. In the given month, the average price of Turkey's wire rod exports stood at $561/mt, decreasing by $38.7/mt month on month and down from the average of $592.5/mt recorded in the same month of 2013.
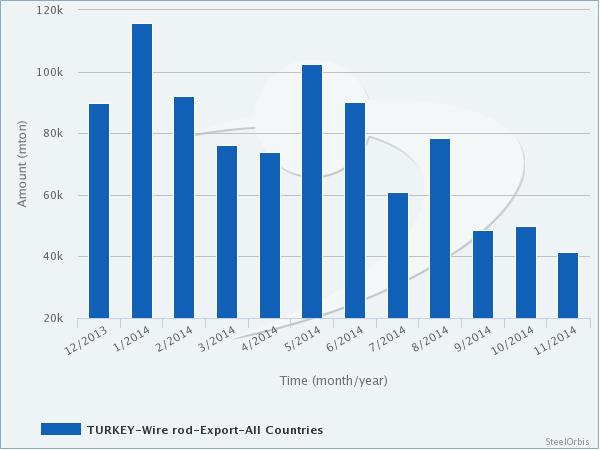
Meanwhile, in the January-November period last year Turkey's wire rod exports decreased by two percent, amounting to 828,318 metric tons, while the value of these exports totaled $492.3 million, down 3.3 percent, both on year-on-year basis.
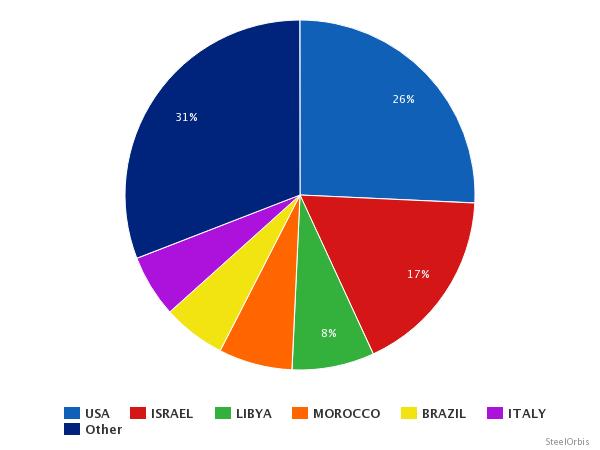
In the first 11 months of 2014, the US ranked first among Turkey's wire rod export destinations by importing 213,202 mt, increasing fivefold (up 433.4 percent) year on year. In the given period, Turkey's wire rod exports to Israel increased by 39.4 percent year on year to 144,038 mt. Israel was followed by Libya, which imported 62,954 metric tons of wire rod from Turkey in the given period, down 40.5 percent year on year.
Turkey's top 10 wire rod export destinations in the first 11 months of last year:
Country | Amount (mt) | |||||
January-November 2014 | January- November 2013 | Y-o-y change (%) | November 2014 | November 2013 | Y-o-y change (%) | |
USA | 213,202 | 39,970 | 433.41 | 18,675 | - | - |
Israel | 144,038 | 103,311 | 39.42 | 1,846 | 7,921 | -76.69 |
Libya | 62,954 | 105,793 | -40.49 | 203 | 1,276 | -84.09 |
Morocco | 56,538 | 222 | 25367.57 | 98 | - | - |
Brazil | 48,060 | 49,514 | -2.94 | 4,716 | 8,430 | -44.06 |
Italy | 47,699 | 54,131 | -11.88 | - | 5,641 | - |
Iraq | 38,536 | 55,057 | -30.01 | 3,794 | 8077 | -53.03 |
Peru | 28,550 | 29,034 | -1.67 | - | 4,258 | - |
Belgium-Luxembourg | 20,005 | 16,241 | 23.18 | - | 101 | - |
Spain | 19,351 | 24,970 | -22.50 | - | - | - |
Turkey's main wire rod destinations on country basis in the first 11 months of 2014 are presented in the chart below: