According to the data provided by the Turkish Statistical Institute (TUIK), in August this year Turkey's wire rod exports increased by 62.75 percent year on year to 78,562 metric tons, up 29.09 percent month on month. The revenue from these exports amounted to $47.4 million, up 63.04 percent year on year and increasing by 28.62 percent month on month. In the given month, the average price of Turkey's wire rod exports stood at $603.34/mt, decreasing by $2.02/mt month on month and up from the average of $602.28/mt recorded in the same month of 2013.
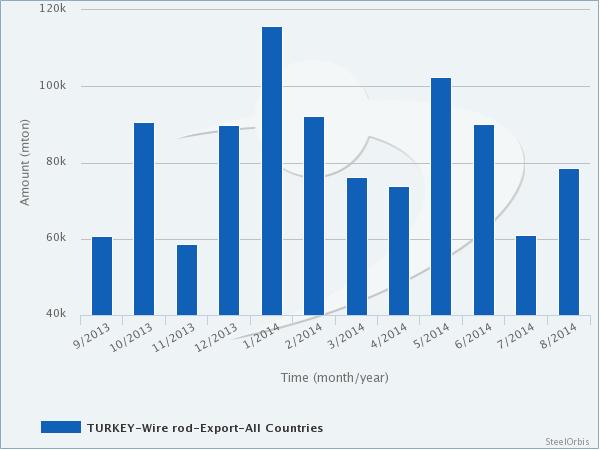
Meanwhile, in the January-August period of this year Turkey's wire rod exports increased by 8.27 percent to 689,009 metric tons, while the value of these exports amounted to $410.78 million, up 6.8 percent, both on year-on-year basis.
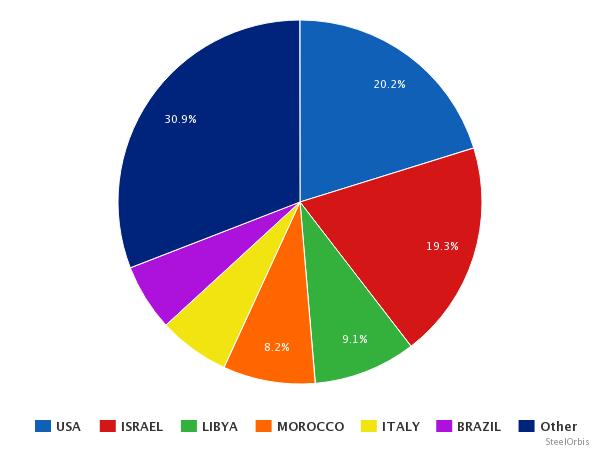
In the first eight months of this year, the US ranked first among Turkey's wire rod export destinations - boosted by import of 52,733 mt of wire rod from Turkey in August - totaling 139,273 mt, up 290.15 percent year on year. In the given period, Turkey's wire rod exports to Israel increased by 56.11 percent year on year to 133,315 mt. Israel was followed by Libya, which imported 62,757 metric tons of wire rod from Turkey in the given period, down 25.94 percent year on year.
Turkey's top 10 wire rod export destinations in the first eight months of this year:
| Country | Amount (mt) | |||||
| January-August 2014 | January-August 2013 | Y-o-y change (%) | August 2014 | August 2013 | Y-o-y change (%) | |
| US | 139,273 | 35,697 | 290.15 | 52,733 | 2,114 | 2394.47 |
| Israel | 133,315 | 85,4 | 56.11 | 7,447 | 3,494 | 113.14 |
| Libya | 62,751 | 84,733 | -25.94 | - | 4,333 | - |
| Morocco | 56,44 | 222 | - | - | - | - |
| Italy | 43,496 | 32,847 | 32.42 | 4,898 | 4,806 | 1.91 |
| Brazil | 40,954 | 31,21 | 31.22 | 1,027 | 1,484 | -30.8 |
| Iraq | 29,164 | 35,258 | -17.28 | 451 | 3,568 | -87.36 |
| Peru | 22,501 | 24,775 | -9.18 | - | - | - |
| Belgium | 20,005 | 196 | - | - | 196 | - |
| Spain | 19,351 | 15,919 | 21.56 | - | - | - |
Turkey's main wire rod destinations on country basis in the first eight months of the current year are presented in the chart below: