According to the data provided by the Turkish Statistical Institute (TUIK), in June this year Turkey's wire rod exports increased by 12.93 percent year on year to 90,049 metric tons, down 12.08 percent month on month. The revenue from these exports amounted to $54.02 million, up 14.02 percent year on year and decreasing by 11.5 percent month on month. In the given month, the average price of Turkey's wire rod exports stood at $599.93/mt, increasing by $3.92/mt month on month and up from the average of $594.20/mt recorded in the same month of 2013.
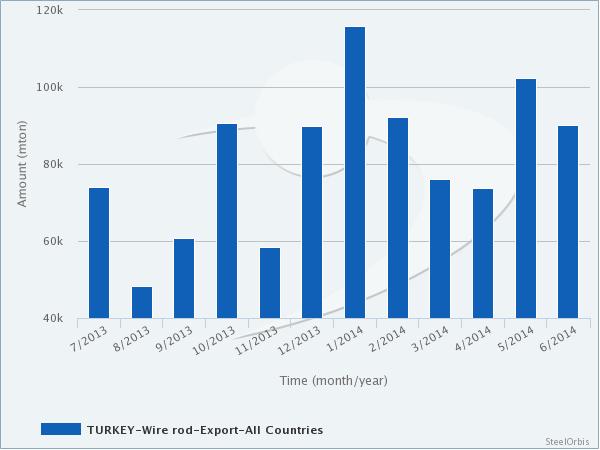
Meanwhile, in the first half of this year Turkey's wire rod exports increased by 6.93 percent to 550,073 metric tons, while the value of these exports amounted to $326.91 million, up 4.67 percent, both on year-on-year basis.
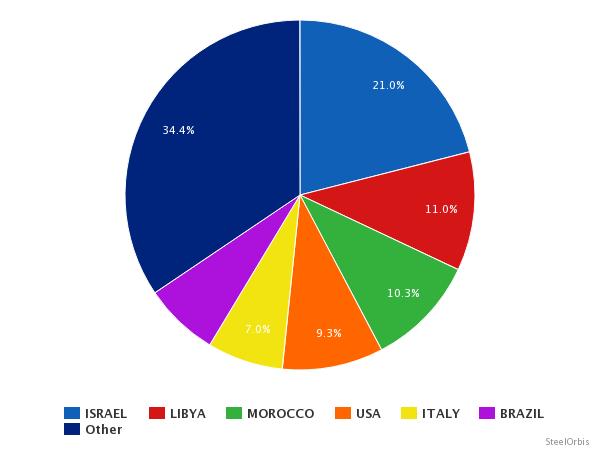
In the first half, Turkey's wire rod exports to Israel rose by 58.73 percent year on year to 115,703 metric tons, ahead of Libya, which received 60,459 metric tons of wire rod from Turkey, down 17.02 percent compared with the same period of the previous year. Libya was followed by Morocco, which imported 56,440 metric tons of wire rod from Turkey in the given period. In June alone, Turkey's top wire rod export destination was the US, which received a total of 18,540 metric tons, up 9.57 percent year on year.
Turkey's top 10 wire rod export destinations in the first half of this year:
| Country | Amount (mt) | |||||
| H1 2014 | H1 2013 | Y-o-y change (%) | June 2014 | June 2013 | Y-o-y change (%) | |
| Isreal | 115,703 | 72,892 | 58,73 | 18,54 | 16,92 | 9,57 |
| Libya | 60,459 | 72,856 | -17,02 | 8,981 | 10,561 | -14,96 |
| Morocco | 56,44 | 223 | - | 13,007 | - | - |
| US | 51,352 | 31,133 | 64,94 | 900 | - | - |
| Italy | 38,592 | 20,163 | 91,4 | 4,963 | 2,615 | 89,79 |
| Brazil | 38,096 | 29,82 | 27,75 | 3,855 | 6,317 | -38,97 |
| Iraq | 25,376 | 25,473 | -0,38 | 2,745 | 3,965 | -30,77 |
| Belgium | 20,005 | - | - | 20,005 | - | - |
| Peru | 19,937 | 19,027 | 4,78 | 5,015 | 5,287 | -5,14 |
| Spain | 19,351 | 15,92 | 21,55 | - | - | - |
Turkey's main wire rod destinations on country basis in the first half of the current year are presented in the chart below: