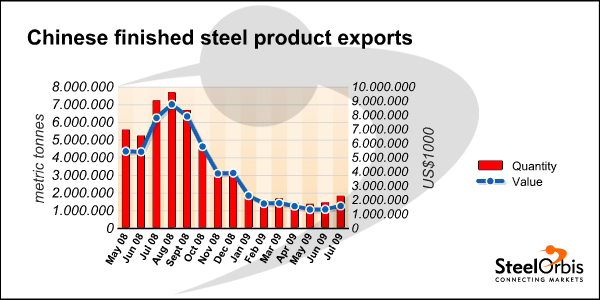
In July, China's finished steel exports totaled 1.80 million mt, down 5.40 million mt or 74.93 percent year on year, totaling a value of $1.598 billion, down $6.227 billion or 79.58 percent compared with the same month last year. In addition, finished steel exports for the January-July period reached 11.16 million mt, down 22.96 million mt or 67.3 percent, amounting to a total value of $11.833 billion, down $21.221 billion or 64.2 percent year on year.
Meanwhile, China's finished steel imports in July totaled 1.7456 million mt, up 306,600 mt or 21.3 percent year on year, totaling $1.814 billion in value, down $410 million or 18.45 percent compared with the same month last year. In addition, finished steel imports for the January-July period reached 9.8798 million mt, up 188,800 mt or 1.95 percent, amounting to a value of $11.14 billion, down $2.447 billion or 18.01 percent year on year.
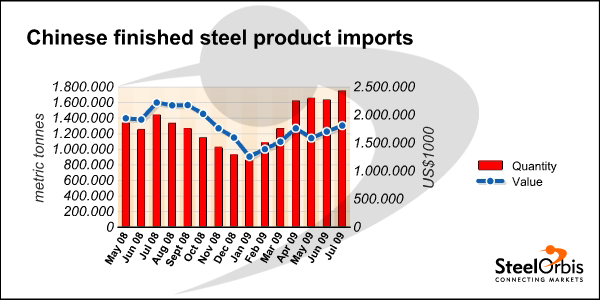
In July, the country's net exports of finished steel amounted to 61,600 mt, with the trading deficit totaling a value of $216 million. The average export price was $884.19/mt, down $201.47/mt or 18.56 percent year on year. The average import price was $1,039.96/mt, down $506.59/mt or 32.77 percent year on year. The export price was $155.17/mt or 14.93 percent lower than the import price.
China's top five steel export destinations in July and in January-July 2009:
Quantity in July (mt) | Revenue in July (US$) | Quantity in Jan-July 2009 (mt) | Revenue in Jan-July 2009 (US$) | |
South Korea | 409,697 | 242,046,771 | 2,439,327 | 2,051,789,535 |
Vietnam | 131,835 | 80,648,346 | 493,315 | 341,923,344 |
60,950 | 48,407,133 | 311,454 | 319,756,769 | |
Algeria | 57,097 | 64,301,881 | 298,672 | 356,925,420 |
55,813 | 104,702,135 | 366,084 | 720,396,393 |
China's top five steel import sources in July and in Jan-Jul 2009:
Quantity in July (mt) | Revenue in July (US$) | Quantity in Jan-July 2009 (mt) | Revenue in Jan-July 2009 (US$) | |
507,615 | 564,167,194 | 2,679,545 | 3,483,265,682 | |
South Korea | 383,510 | 318,395,934 | 2,388,505 | 2,121,817,255 |
229,946 | 236,488,408 | 1,278,235 | 1,346,192,063 | |
215,448 | 94,642,890 | 863,971 | 436,880,072 | |
187,927 | 135,425,982 | 1,103,877 | 813,338,128 |