In October this year, Turkey's rebar exports amounted to 641,009 metric tons, decreasing by 7.5 percent year on year, but up 4.7 percent from the previous month, according to the data provided by the Turkish Statistical Institute (TUIK). Meanwhile, the revenue generated by these exports totaled $355.86 million, increasing by 2.3 percent compared to October 2013 and up 2.9 percent from the previous month.
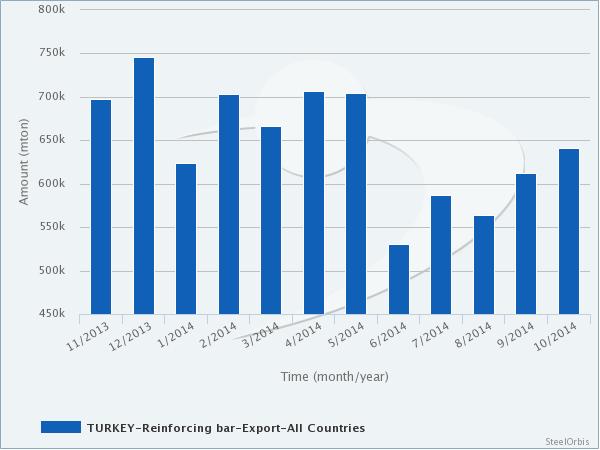
On the other hand, in the January-October period of this year Turkey's rebar exports stood at 6.27 million metric tons, down 5.6 percent year on year, while the total revenue of these exports amounted to $3.53 billion, decreasing by 9.2 percent year on year.
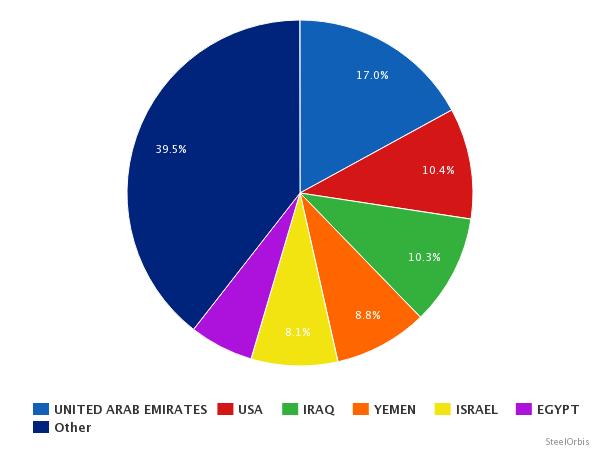
In October this year, Turkey's largest rebar export destination was the UAE which received 180,806 metric tons, up 67.7 percent year on year. The UAE was followed by the US with 71,937 metric tons, up 219.9 percent, and Israel with 37,519 metric tons, up 76.5 percent, both on year-on-year basis. In the first 10 months, while the UAE ranked as Turkey's leading rebar export destination, the US occupied second place ahead of Iraq by importing 649,744 mt of reaber from Turkey, up 41.9 percent year on year.
Turkey's top 10 rebar export destinations in the first 10 months of this year:
| Country | Volume (mt) | |||||
| January-October 2014 | January-October 2013 | Y-o-y change (%) | October 2014 | October 2013 | Y-o-y change (%) | |
| UAE | 1,068,347 | 969,999 | 10.14 | 180,806 | 107,806 | 67.71 |
| US | 649,744 | 457,936 | 41.89 | 71,937 | 22,486 | 219.92 |
| Iraq | 646,79 | 1,236,884 | -47.71 | 33,212 | 137,801 | -75.9 |
| Yemen | 548,354 | 495,565 | 10.65 | 24,139 | 99,879 | -75.83 |
| Israel | 505,935 | 408,347 | 23.9 | 37,519 | 21,259 | 76.49 |
| Egypt | 374,842 | 75,816 | 394.41 | 36,254 | 6,501 | 457.67 |
| Ethiopia | 213,655 | 229,281 | -6.82 | 18,894 | 6,314 | 199.24 |
| Libya | 210,819 | 333,388 | -36.76 | 8,601 | 34,655 | -75.18 |
| Brazil | 201,389 | 171,983 | 17.1 | 18,872 | 39,242 | -51.91 |
| Saudi Arabia | 179,562 | 440,289 | -59.22 | 19,7 | - | - |
Turkey's main rebar export destinations on country basis in the first 10 months of the current year are presented in the chart below: